A worked example of Value-Stream Mapping
Value-stream maps can be daunting at first glance like these maps on Google Images. ValueTech (a made-up software company for the purpose of our example) thought so too until they created the map below. We’ll walk through how they did it: starting with mapping the current state followed by mapping a future-desired state in order to plan out improvements.
We are using Miro to create the map. The notation and mapping process are a personal adaptation of what is usually found in books on the topic. Naturally, don’t take the methods described here as prescriptive.
Mapping the current state
Everyone who participates in software development process at ValueTech as well as everyone who can authorise improvement plans have gathered in a virtual meeting room: the CTO, the product manager, the lead developer and several representative developers. There is also a facilitator with past mapping experience.
1. Create a legend
The facilitator starts by defining all the symbols that are going to be used while mapping.

2. Map the customer
We place a symbol for the entity for whom we are creating value in the center of our map. For ValueTech, this is the “Customer”.

3. Map processes
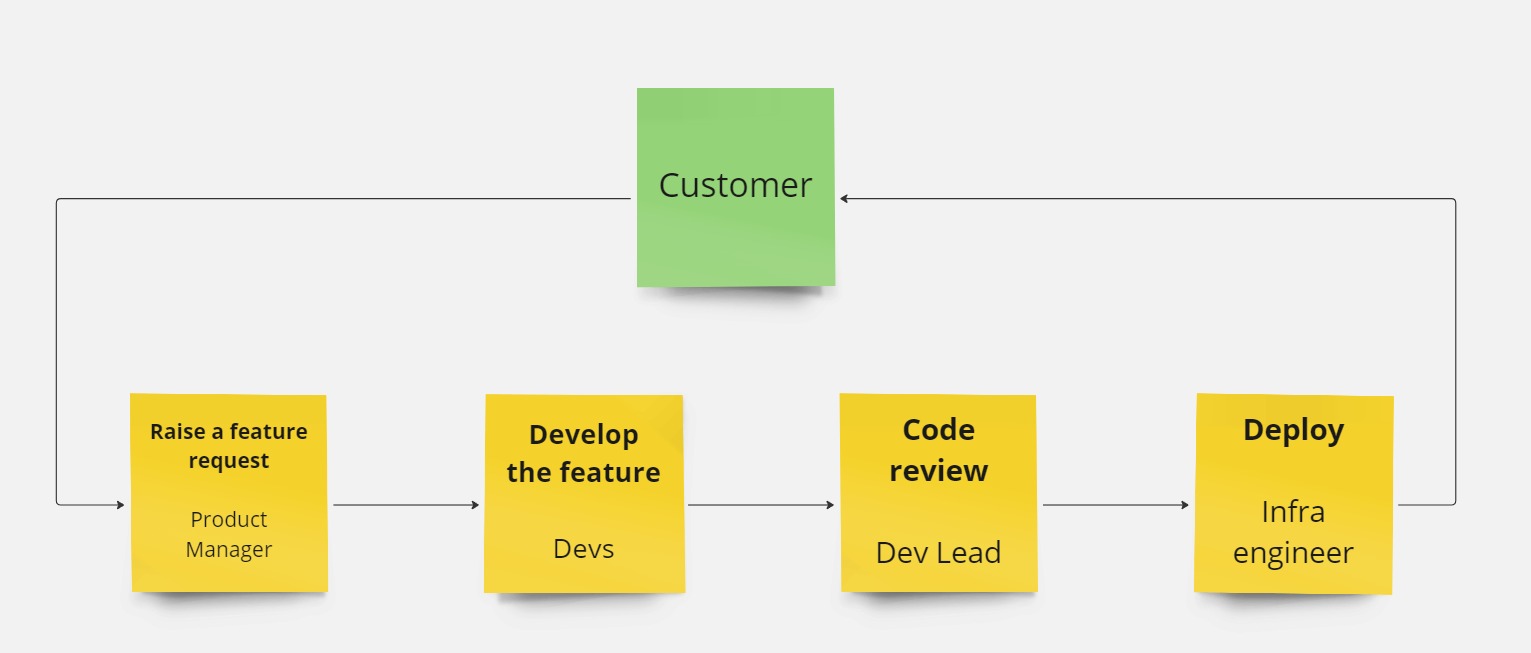
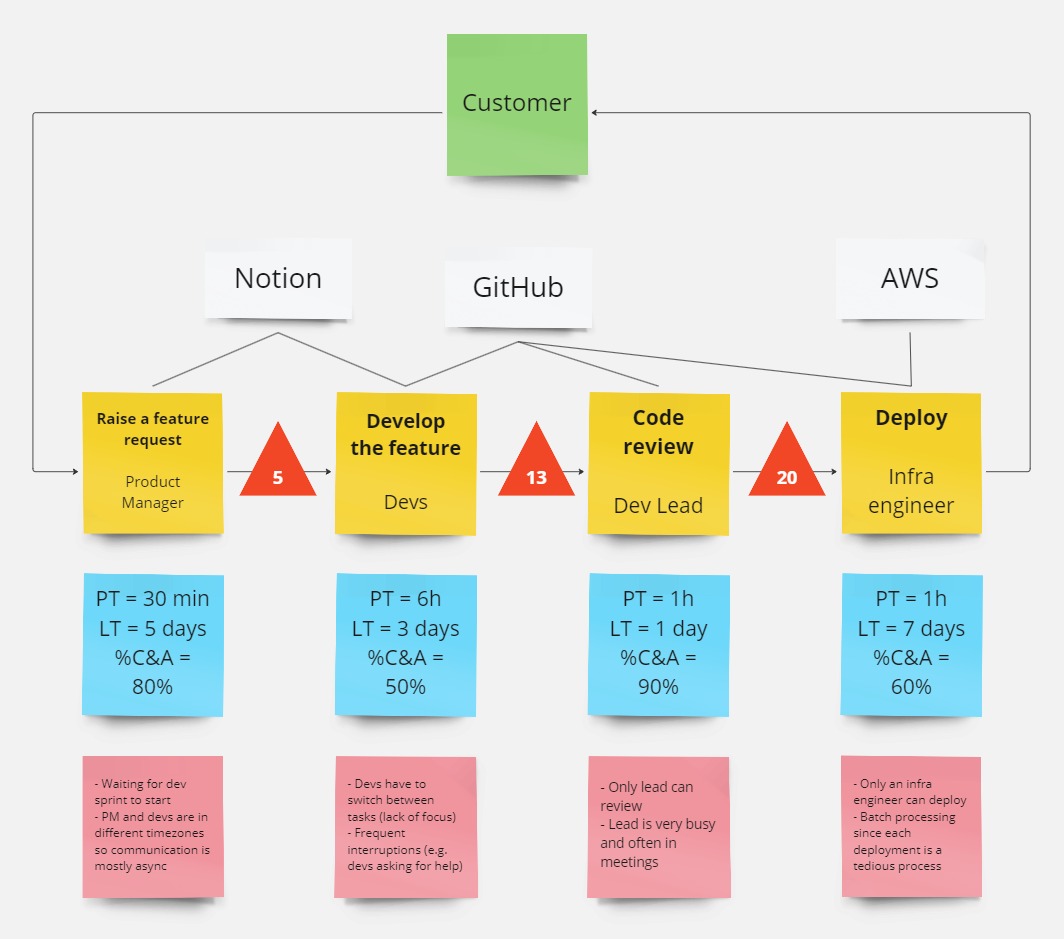
We then map out each disjoint process that is carried out to fulfill the customers need. We mention the action in the upper half of our post-it and the actor in the bottom half.

All the processes are listed linearly. Note that we focus on the critical sequence here (i.e. the sequence that dominates delivery time). Parallel steps can be listed if they contribute significantly to the delivery time. In case of ValueTech there aren’t any.
4. Inventory
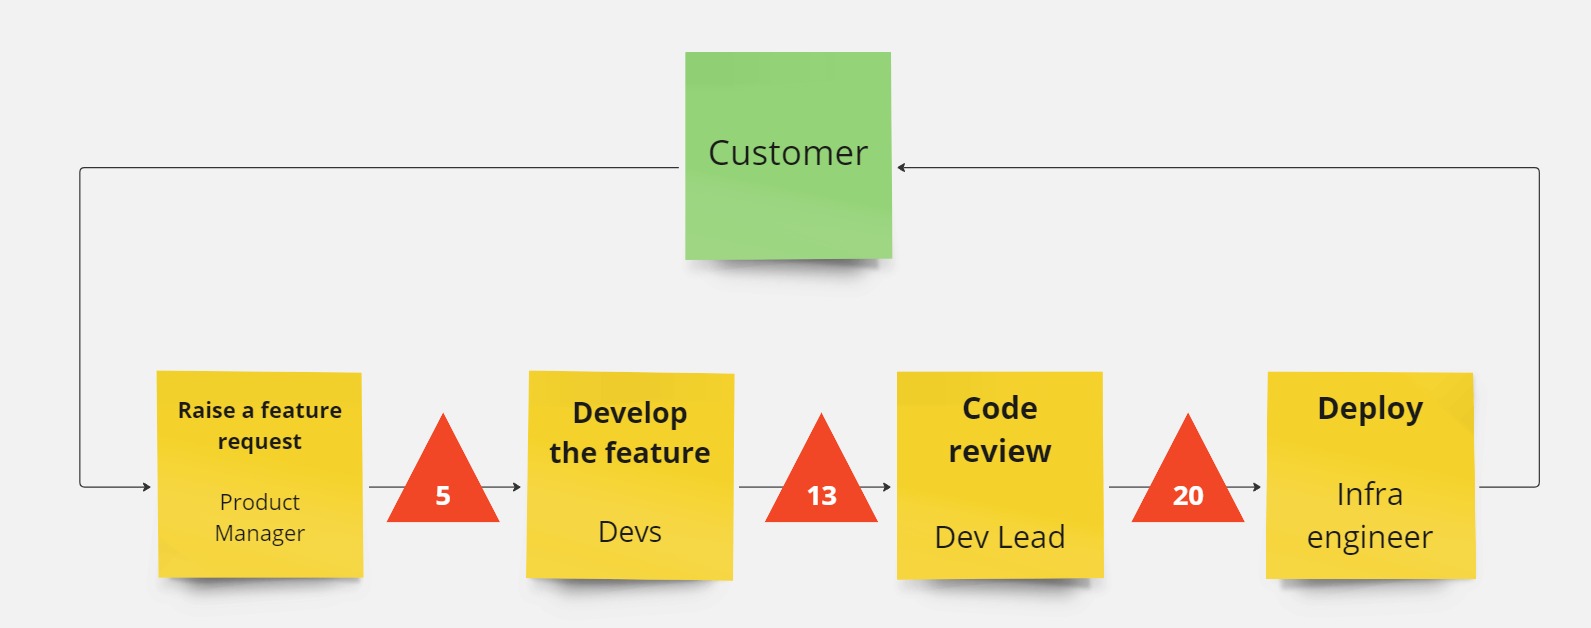
Preceding each process, we add how much work is in progress as well as how much work is waiting to be processed. We call this our inventory.
For the review step, we’re unsure how much inventory there usually is. So we just sample how many there are right at this very moment and use that figure.
5. Add process metrics
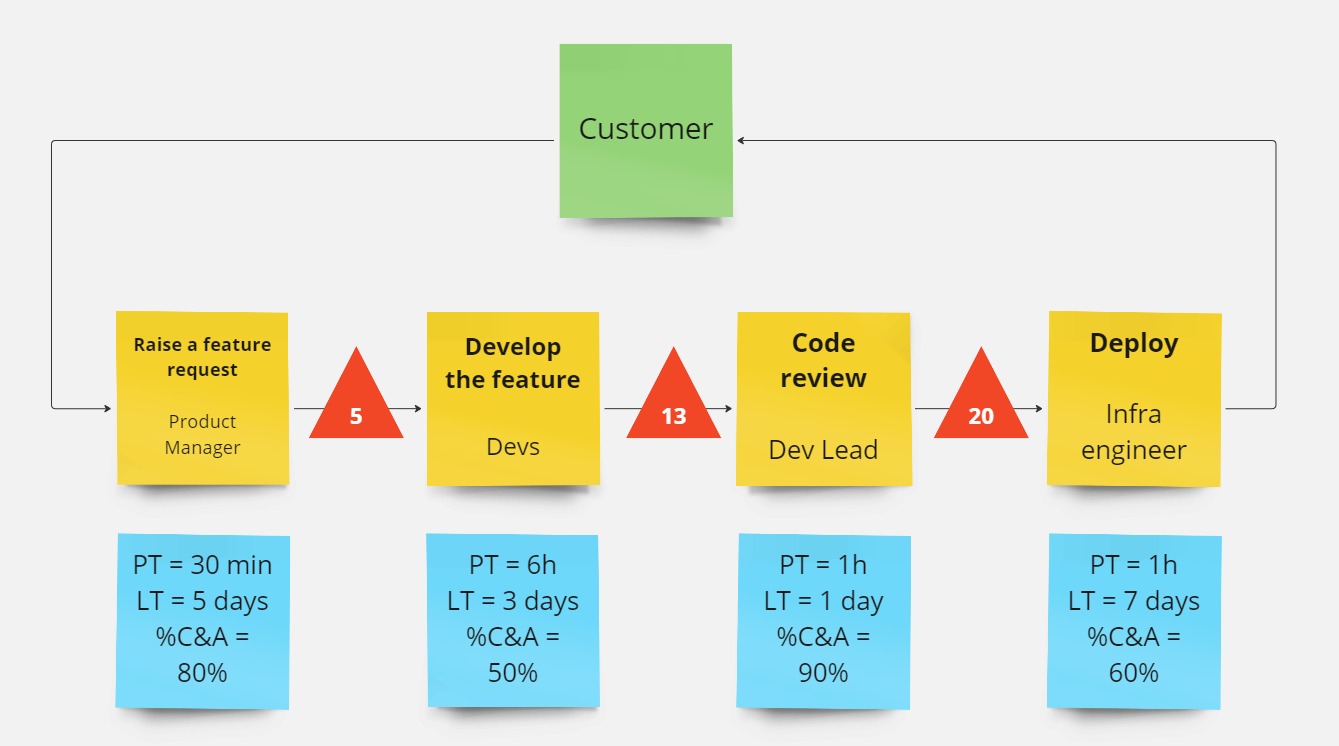
- Process time is also known as “touch time”. This is the time that we are actively working on something.
- Lead time is process time plus all the time that work is waiting to be worked on.
- Percentage complete and accurate (%C&A) is the percentage of times that work is reported as defective by the subsequent process step.
If there are any other metrics important to the value-stream, those can be noted down too.
Note that figures need not be very accurate but only indicative of times in the context of the rest of the stream.
6. Add barriers to flow
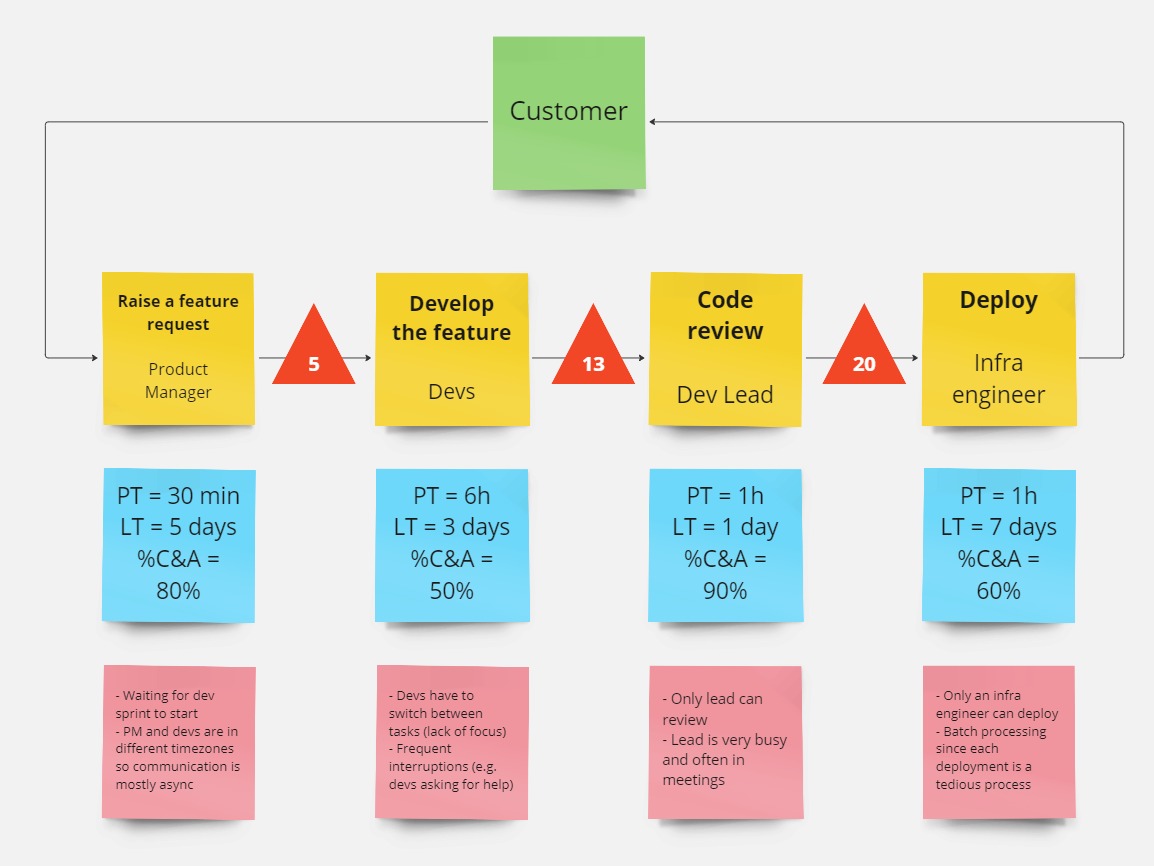
Here we list down barriers to flow for each process. They indicate why inventory piles up between steps, why process time lags lead time and why defects/rework is reported by the subsequent process.
7. Add information systems
We map out the tools and systems that each process is dependent on.
8. Summarise metrics
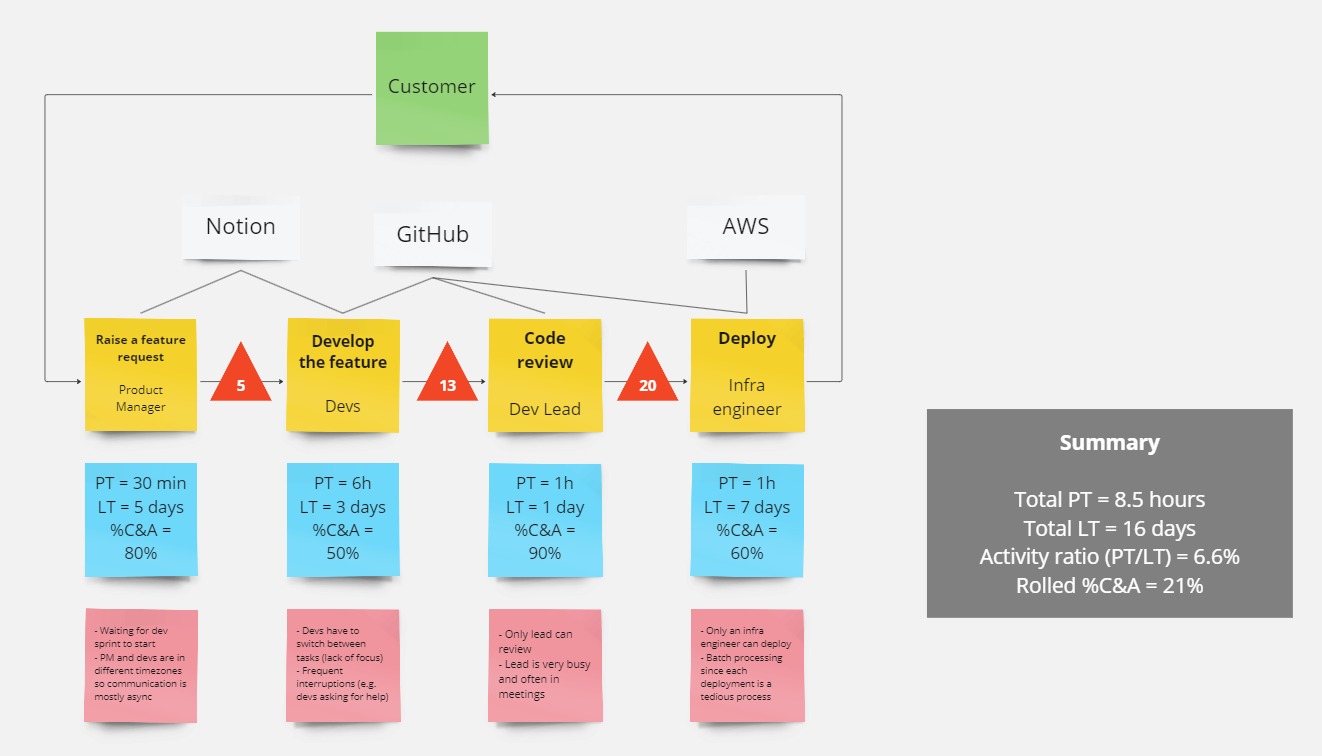
We create a summary of the metrics listed against each process.
- “Rolled %C&A” is computed by multiplying all the process-level %C&As. Multiplication is indicative of the compounding effect of quality drops through the stream.
- “Activity ratio” is computed by dividing total process time by total lead time.
Planning improvements
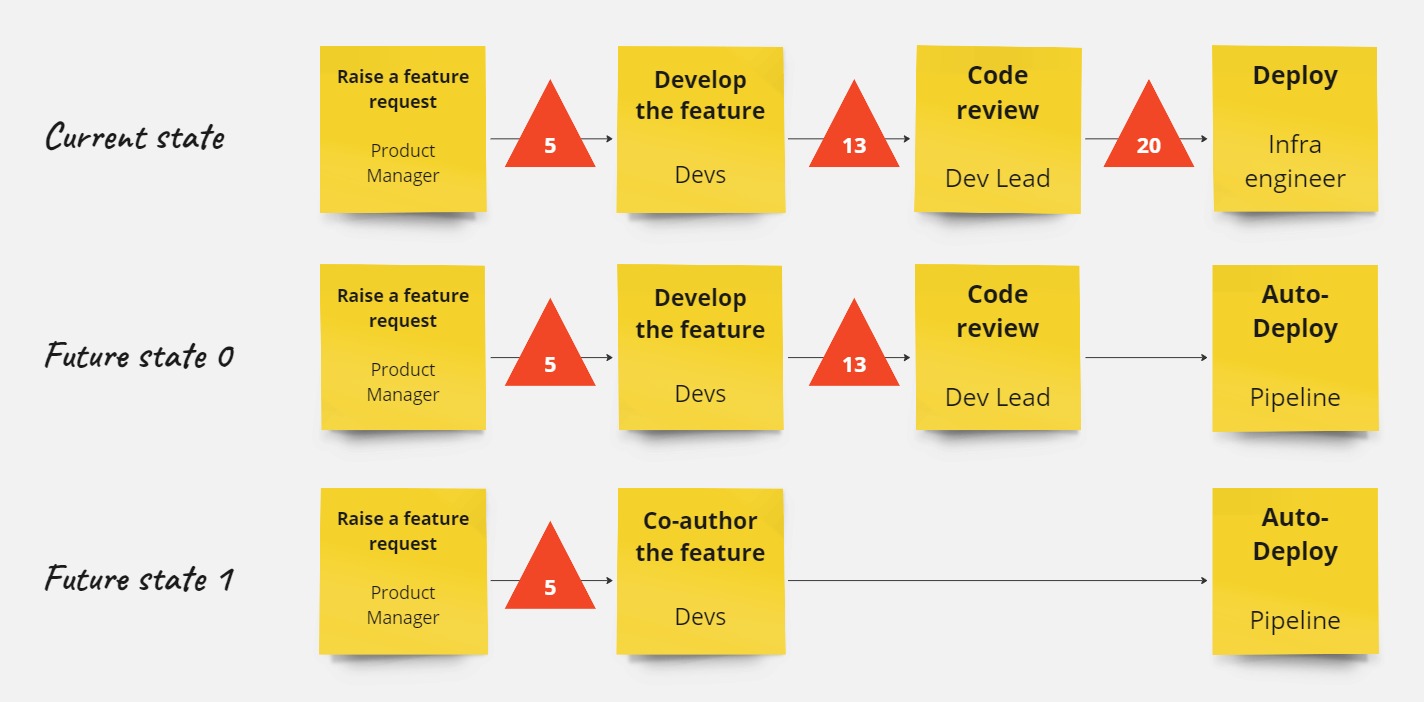
9. Create a future state map
We envision a state of our value stream with improved flow which we call the future state. Books on value-stream mapping generally recommends to do this step a day after creating the current state map.

10. Break the future state into increments
Two increments are proposed:
- Automating the deployment process
- Consolidating the development and review processes into one step (by way of pair-programming)
Why did we choose to automate the deployment process before improving the review process?
Inventory that piles up at the deployment stage is larger than the review process. Lead time is also more than the lead time of review. If we were to improve the review process first, it would only cause more inventory to pile up at the deployment stage. More inventory would potentially lead to larger delays in deployment, make it harder to pinpoint which change caused a deployment to fail and so on.
Relevant
-
Notes on Value-Stream Mapping
A value stream is the sequence of activities required to design, produce, and deliver a good or service to a customer. – Value Stream Mapping by Karen Martin and Mike...
-
Leveraging 1x1 production to improve flow
In its ideal, 1x1 production means that parts move from one value-adding processing step directly to the next value-adding processing step, and then to the customer, without any waiting time...
-
Automobile assembly line kata
This is the blueprint for practical workshop to learn about lean principles. We run a simulation of an automobile assembly line using LEGO blocks. If LEGO blocks are not available,...
-
Just because inventory is invisible...
Inventory is unfinished work – that which hasn’t yet reached the customer. The presence of inventory indicates that costs have been incurred however value or revenue hasn’t been extracted. And...
Recent posts
-
Test pyramid and ice-cream cone
The test ice-cream cone is a strategic anti-pattern. It indicates excessive reliance on expensive and flaky forms of testing, such as manual and end-to-end, especially for components that could otherwise...
-
First experience with Event Storming
Event Storming is a technique that uses post-it notes to map out a business domain. Alberto Brandolini initially used it as a means to identify aggregates in the context of...
-
My library
This is a list of books I have read in the first decade of my professional career. I started quite late so most if not all were read in the...